Technical lighting
Abbas Tcharkhtchi, Professor Emeritus at ENSAM and a well-known researcher in the world of rotational moulding, each AFR and ARMO newsletter sheds light on a technical topic.
Would you like to suggest a theme? Don't hesitate to send us a message.
Introduction
In the rotational moulding process, the polymer is confined in an opaque, biaxially rotating metal mould and subjected to a complex heating and cooling cycle. This configuration makes it impossible to observe directly the phenomena that take place inside the mould: particle melting, coalescence, densification, outgassing, liquid-solid transition, crystallisation, contraction and detachment. The only experimental means of gaining access to these invisible phenomena is by analysing the temperature-time curve (T-t diagram) measured at the heart of the process. Thanks to on-board systems such as DATAPAQ, capable of withstanding the high temperatures of the oven and simultaneously recording several critical temperatures (internal air, internal wall, external wall, powder or molten polymer), it is now possible to reconstruct in detail the actual thermal behaviour of the mould-polymer system.
This T-t diagram is the most fundamental tool for understanding rotational moulding, as it is the only window open onto what is happening in the internal volume of the mould. Not only does it enable the transitions in the state of the polymer to be identified (onset of melting, total melting, molten state, crystallisation, solidification, debonding), but it also enables the heating kinetics to be controlled, the maximum permissible temperature to be defined, the oven residence times to be chosen and the cooling phase to be controlled. Without this diagram, process optimisation would be based on empirical, slow and imprecise approaches. With it, rotational moulding becomes a controlled, reproducible and scientifically controlled process. The following analysis sets out, in a continuous and detailed manner, the complete interpretation of a typical rotational moulding cycle based on the T-t diagram illustrated in the following figure.
Detailed analysis of the rotational moulding cycle using the T-t diagram
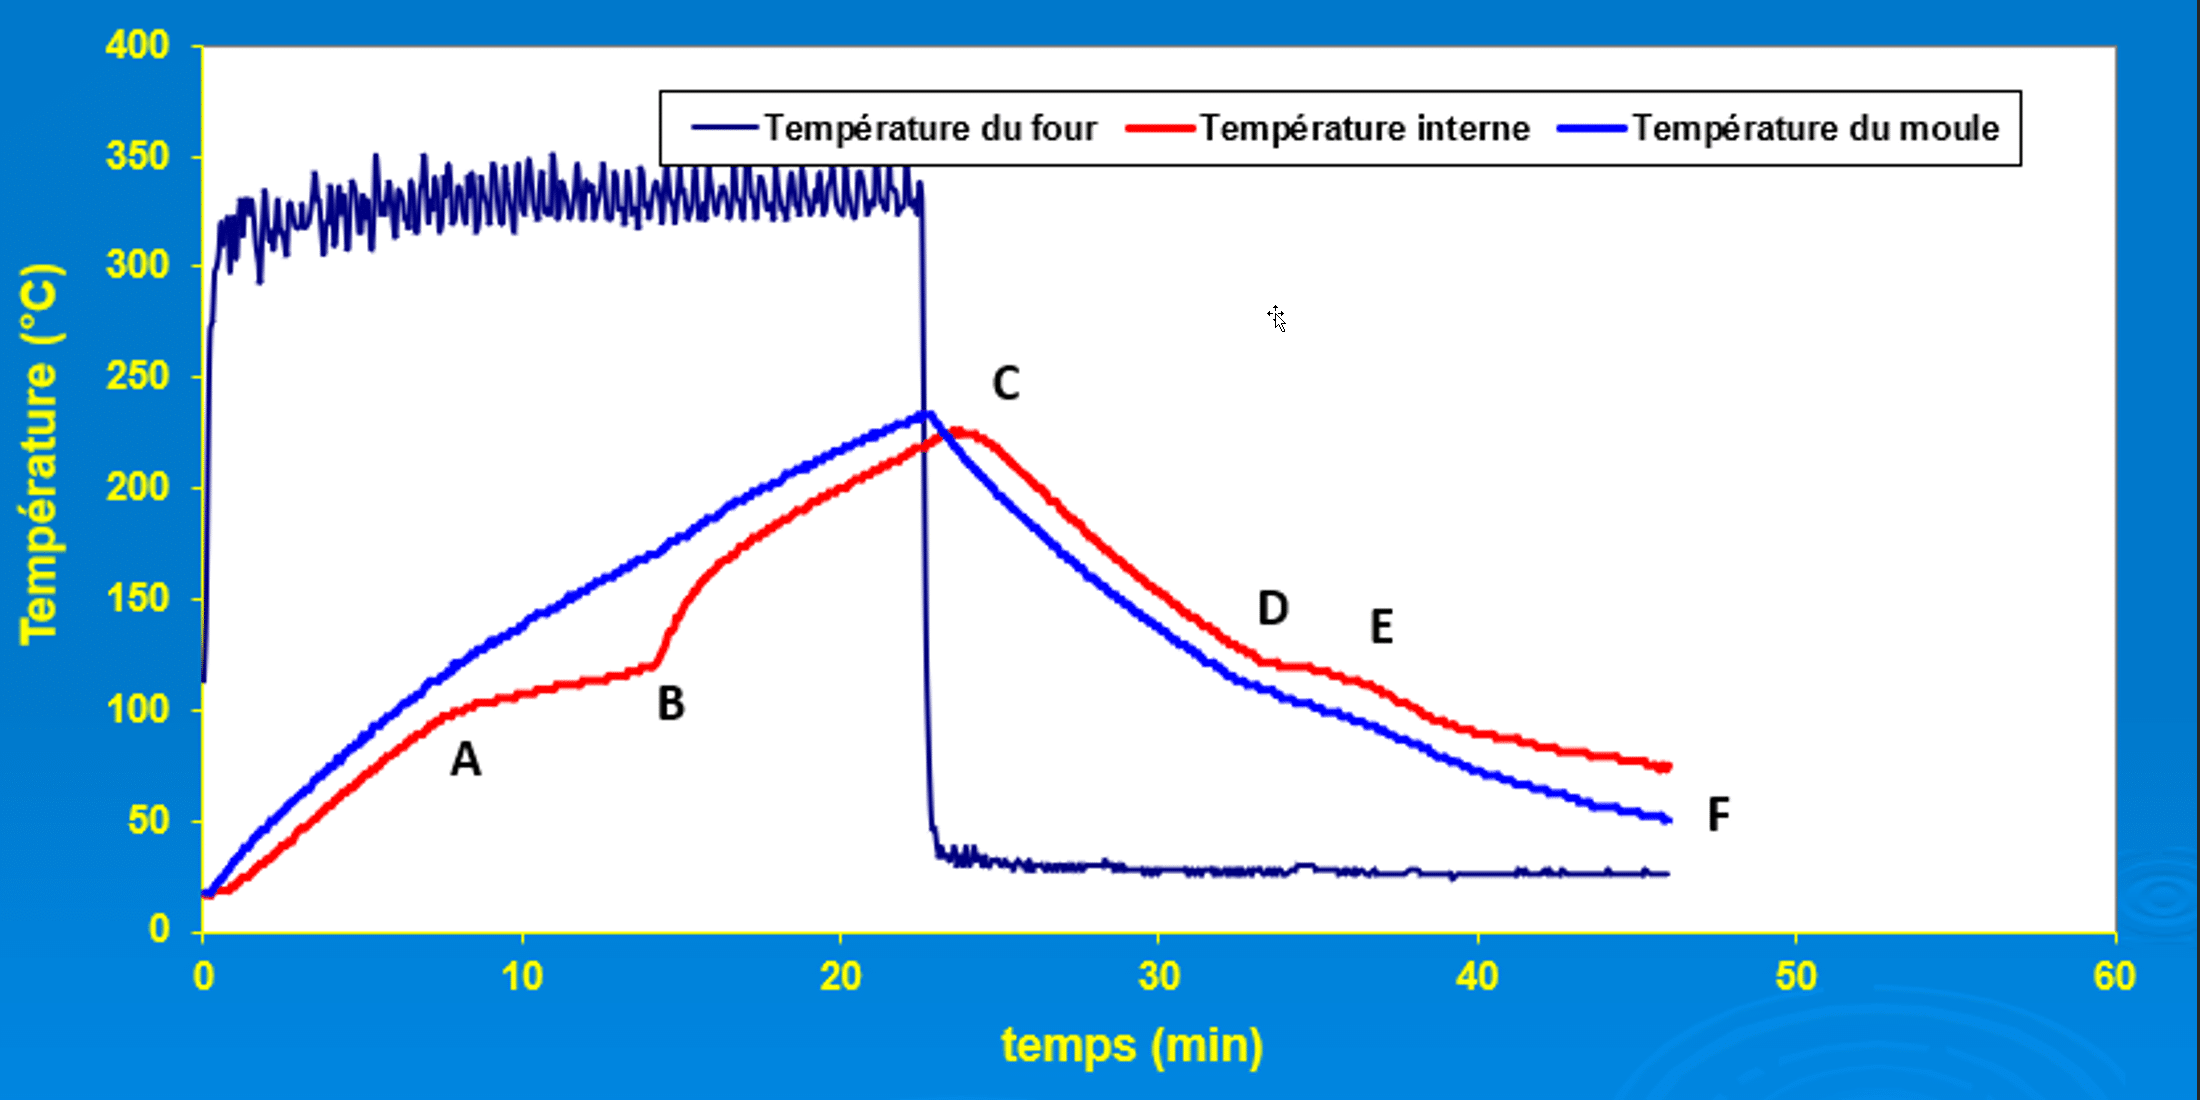
At the start of the cycle, as shown in the time-temperature diagram, the mould and polymer powder are at room temperature. As soon as the oven starts to heat up, the internal temperature of the mould rises rapidly, as the metal wall efficiently conducts the heat inwards. The powder, still cold and free in a biaxially rotating mould, offers no significant thermal resistance, creating an initial quasi-linear rise dominated by conduction and the heat capacity of the polymer. This phase corresponds to a regime in which heat propagates without major disturbance throughout the internal volume.
Point A - Start of particle fusion
When the cycle reaches point A, the first break in slope appears on the diagram: this is the start of particle melting. The energy absorbed by the polymer is no longer used solely to increase its temperature, but also to cross the solid-liquid transition. The temperature rise slows down, reflecting the absorption of latent heat. At the same time, a first molten layer adheres to the mould, creating an additional thermal barrier. This is a decisive moment, as the quality of this first layer influences the regularity of the final thickness of the part.
Between A and B - Coalescence and densification
From this point onwards, the curve progresses with a gentler rise, corresponding to the phase when the powder continues to melt. Between A and B, the diagram accurately reflects the evolution of coalescence: the molten grains gradually weld together, sticking to each other and forming successive continuous layers along the wall. Under the effect of densification, the air initially trapped between the particles migrates towards the inside of the mould or escapes through the melt, increasing the density of the polymer. The curve thus reflects the competition between the heat transferred from the mould and the energy absorbed by the melting and internal unification mechanisms. For semi-crystalline polymers, this zone also corresponds to the gradual disappearance of the initial crystallites; for amorphous polymers, the transition is more diffuse, but is still visible on the diagram as a clear slowdown in the rise in temperature.
Point B - Total disappearance of solid particles
Point B corresponds to the complete disappearance of the solid particles. At this point, the entire polymer has melted and the curve rises more steeply, indicating that the heat is no longer absorbed by the melt but is now transferred almost entirely to the molten mass. This resumption of the slope indicates that coalescence is complete, while the densification that began earlier continues: the air still present in the melt continues to migrate. From this point onwards, the air migrates mainly by diffusion through the melt. The polymer, which has become viscous, homogeneous and completely fluidised, spreads evenly over the inside walls of the mould.
Between B and C - Rise to maximum temperature
Between B and C, the temperature rises until it reaches a carefully controlled maximum. This phase corresponds to the period when the viscosity decreases sufficiently for any air bubbles still present to rise, dissipate or evacuate to the internal air of the mould. The diagram clearly shows this steady rise, a sign that the polymer has reached optimum fluidity to improve internal quality. However, this zone is also critical: if the temperature remains too low, the part retains porosities; if it is too high, the polymer risks entering the degradation zone. The T-t diagram therefore makes it possible to define this thermal window with great precision.
Point C - Thermal peak of the cycle
Point C represents the thermal peak of the cycle. At this point, the polymer has reached its maximum transformation temperature, which ensures complete densification without exceeding thermal stability limits. The curve shows a clear peak corresponding to the moment when heating is interrupted and the mould is removed from the oven. This point is an essential benchmark for adjusting the residence time and guaranteeing consistent quality from one cycle to the next.
Cooling phase
When the mould is introduced into the cooling zone, the curve descends steadily. As long as the polymer remains molten, the temperature follows an almost linear decrease. This phase reflects heat transfer dominated by external convection in the cooling chamber and the relatively homogeneous conductivity of the melt. The slope depends on the surface/volume ratio of the mould and the cooling conditions imposed.
Point D - Crystallisation / Solidification
Around point D, a characteristic plateau appears in the diagram. This slower temperature drop corresponds to the change in physical state: crystallisation for semi-crystalline polymers or progressive solidification for amorphous polymers. During this phenomenon, latent heat is released, temporarily damping the drop in temperature. The diagram thus becomes a true thermodynamic signature of the material, enabling its temperature and crystallisation kinetics to be accurately identified under actual process conditions. The zone corresponding to point D is very important for the final morphology of the part. The rate of crystallisation influences the size of the lamellae, density, rigidity, shrinkage and, in general, all the mechanical properties. The T-t diagram is therefore an essential tool for the engineer, enabling the actual thermodynamics of the cycle to be linked to the final microstructure and performance of the part.
After crystallisation, the curve takes on a steeper downward slope. The polymer is now solid and begins to contract under the effect of cooling. This contraction gradually causes the part to separate from the mould. This change in thermal regime is clearly visible in the diagram, which reflects the gradual reduction in direct conduction between the mould and the part.
Point E - Part separation
Around point E, the part becomes more clearly detached, resulting in an even more visible change in the slope of the curve. The thin layer of air created between the inner wall of the mould and the part acts as a natural insulator. Heat is transferred mainly by convection through this layer of air and by limited conduction. The diagram shows precisely when the part ceases to be in intimate contact with the mould. This post-solidification phase is decisive for the final dimensional quality. Cooling too quickly can lead to high residual stresses, while cooling more gradually allows more effective thermal relaxation. The evolution of the T-t curve can be used to check that the cooling regime is compatible with the mechanical and geometric integrity of the part.
Point F - Demoulding
When the curve reaches point F, the part has reached a temperature low enough to be demoulded without deformation. The diagram confirms that the part has completed its major thermal contraction and has the necessary rigidity to be handled. This point marks the end of the polymer's thermal cycle and the completion of the transformation.
